Nitrous oxide emissions from the oxygen minimum zones
In aquatic settings, nitrous oxide is produced by multiple bacteria and archaea species through two major pathways: nitrification and denitrification. Nitrification is a multi-step aerobic process that generates nitrous oxide as a by-product of hydroxylamine oxidation to nitrite. Nitrifiers also produce nitrous oxide as an intermediate of nitrifier-denitrification under oxygen-limiting conditions. On the other hand, denitrification is an anaerobic metabolism that both produces and consumes nitrous oxide as an intermediate metabolite for denitrifying bacteria. Low-oxygen environments are hotspots of nitrous oxide emissions because denitrification occurs under anoxic conditions and the nitrous oxide production efficiency of both nitrification and denitrification increases under low but non-zero oxygen conditions. Additionally, when oxygen concentrations are below detection in oxygen-deficient zones, typically at the core of larger permanent oxygen minimum zones, nitrous oxide is consumed by denitrification.

Microscopy image of denitrifying bacteria colonies in a synthetic organic particle from Smriga et al., 2021, Comm. Bio. We thank Steven Smriga and Davide Ciccarese for the microscopy image.
High-frequency nitrous oxide and carbon monoxide measurements
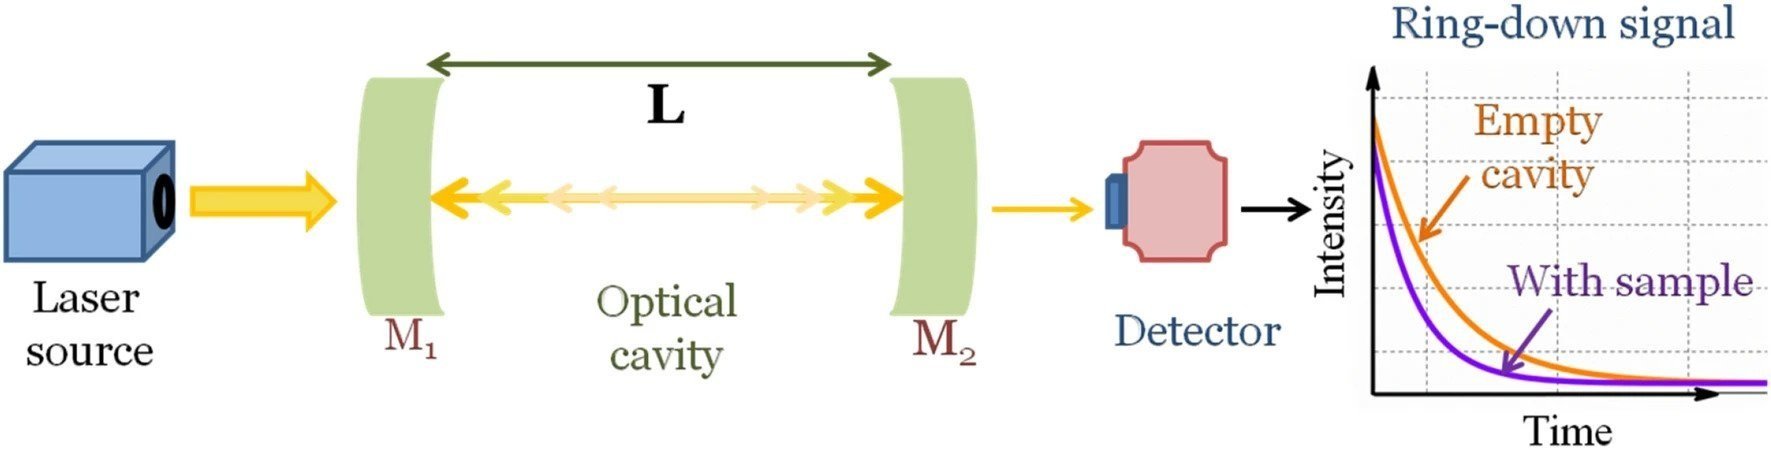
Conceptual diagram of Cavity Ring-down Spectroscopy (CRDS) method from Maithani and Pradhan, 2020, J. Chem. Sci.

Nitrous oxide and carbon monoxide atmospheric mixing ratios are measured using a cavity ring-down spectrometer (G5310, Picarro Inc.) located at GEMS. Briefly, the cavity ring-down spectrometers consist of 3 main parts, (i) a laser source that generates monochromatic light absorbed by the target molecule, (ii) an optical cavity containing two highly reflective mirrors, (iii) a detector that measures light transmitted through the mirrors. In the optical cavity, light is reflected between the mirrors multiple times, and only a very small portion of the light is transmitted through the mirrors and detected by the monitor. The decay of detected light intensity is slower in an empty cavity compared to a cavity filled with the air sample. Therefore, the difference in the light intensity decay is utilized to calculate the nitrous oxide and carbon monoxide concentration in the sampled air.
Lagrangian Particle Dispersion Models

Estimated nitrous oxide disequilibrium in the surface ocean calculated using a Lagrangian Particle Dispersion Model from Babbin et al., 2020, Nat. Comm. We thank Elisa Boles for their work on back-trajectory calculations presented above.
Atmospheric back trajectories calculated using the HYSPLIT Lagrangian Particle Dispersion Model for air masses sampled at the GEMS station. The video shows the location of particles/air masses backward in time.
Lagrangian Particle Dispersion Models (LPDM) calculate the trajectories of particles and air masses backward and forward in time using meteorological information such as wind speed, wind direction, etc. Babbin et al., 2020, showed that air masses transported from the eastern tropical Pacific Ocean oxygen-deficient zones have higher nitrous oxide concentrations compared to the air masses transported from the rest of the Pacific Ocean. Oxygen-deficient zones in the eastern tropical Pacific are extensively studied in the literature and release significant nitrous oxide into the atmosphere. However, previous atmospheric nitrous oxide monitoring stations, e.g. AGAGE (Advanced Global Atmospheric Gasses Experiment) station in American Samoa, are far from the hot spots of marine nitrous oxide emissions. However, GEMS is strategically located close to the eastern tropical Pacific oxygen-deficient zones to better estimate emissions from this region.